Administration graphs
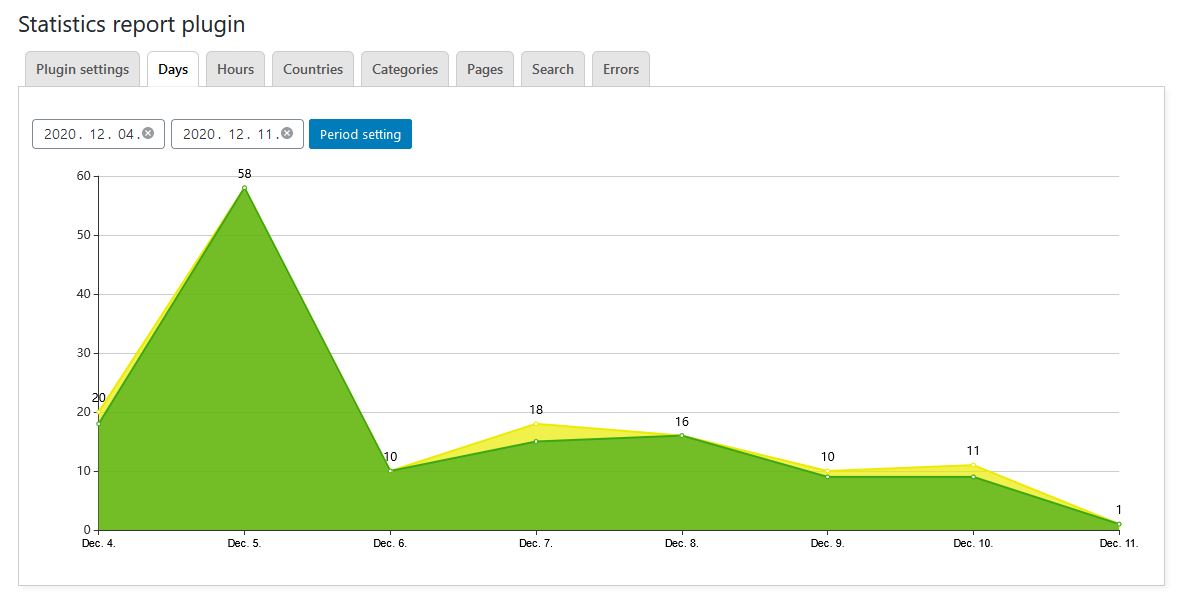
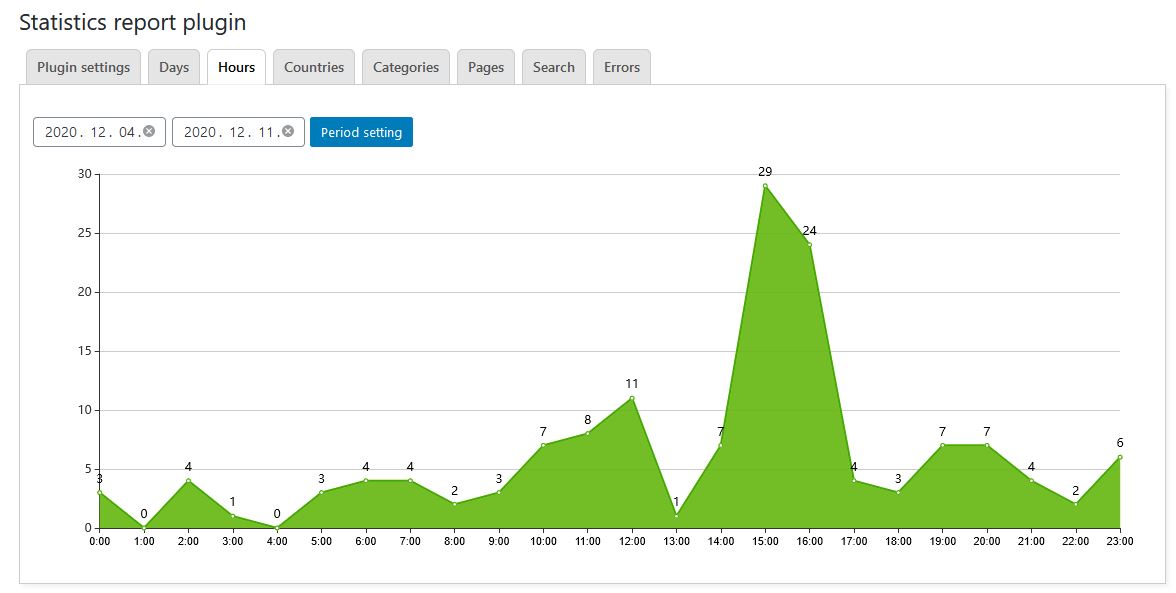
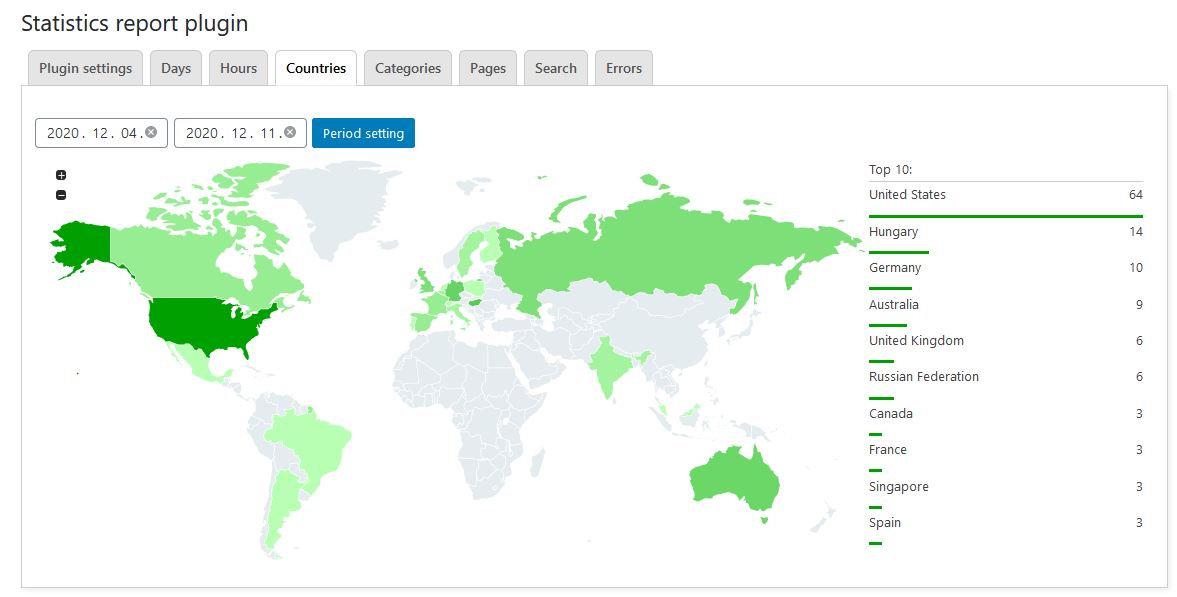
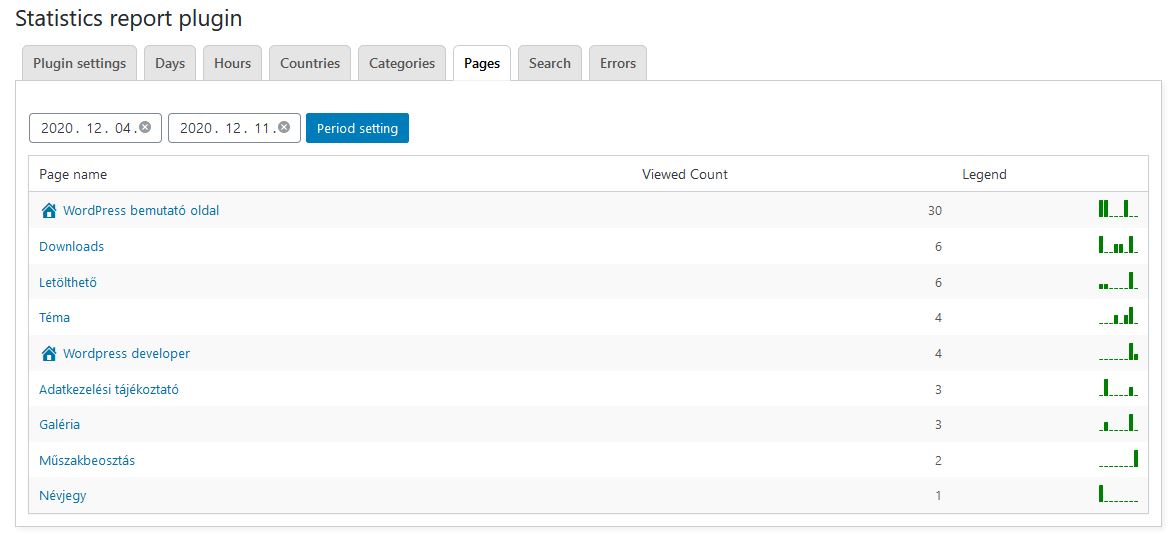
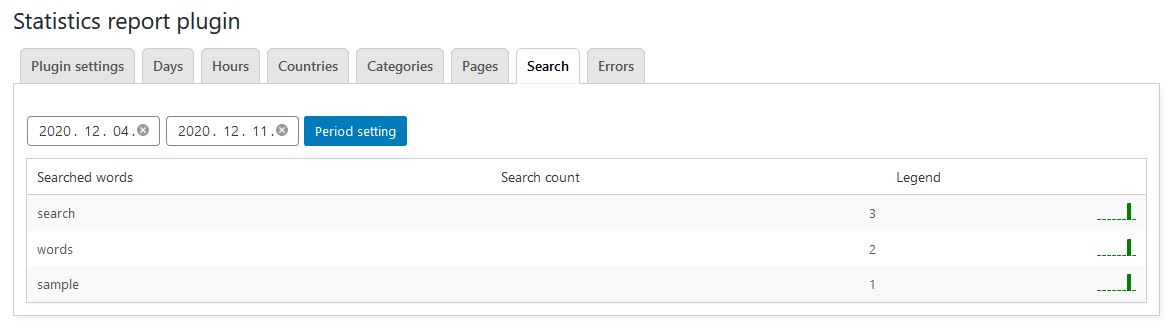
The graphs available in the administration interface are illustrated by the following examples:
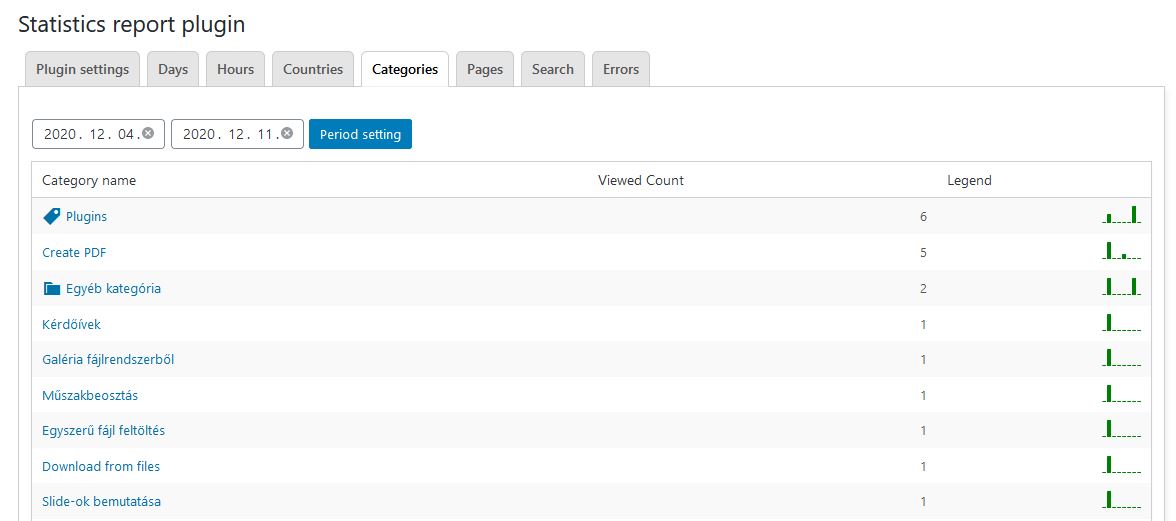
The small green graph in the last column indicates daily downloads, where each column represents a day.
The small green graph in the last column indicates daily downloads, where each column represents a day.
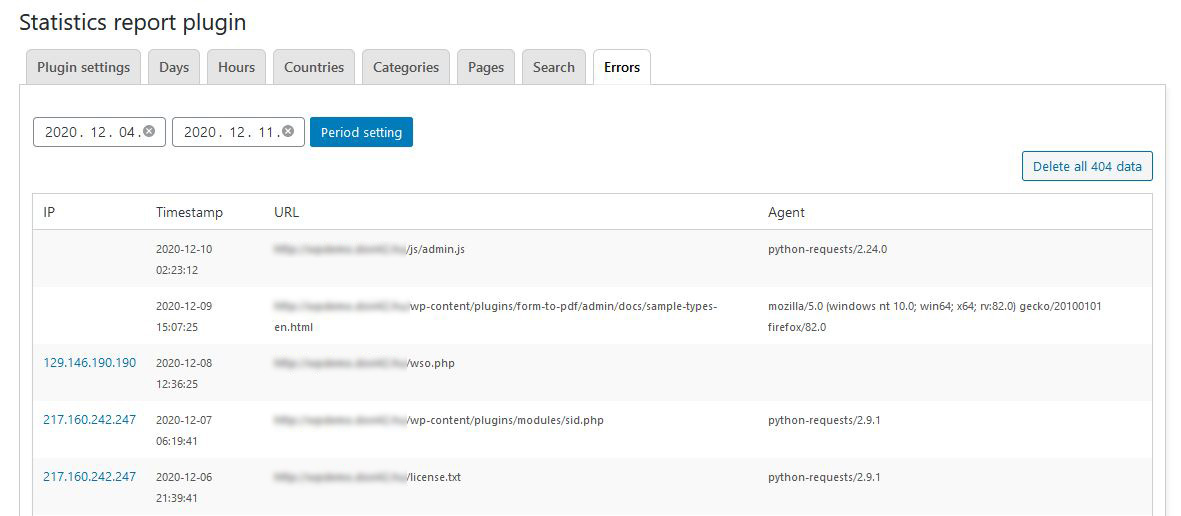
These requests are the ones that ran on error 404.
It also shows here what the robots are trying to do.